Canonical Protein Isoform Analysis
Analyze canonical peptides across protein isoforms.
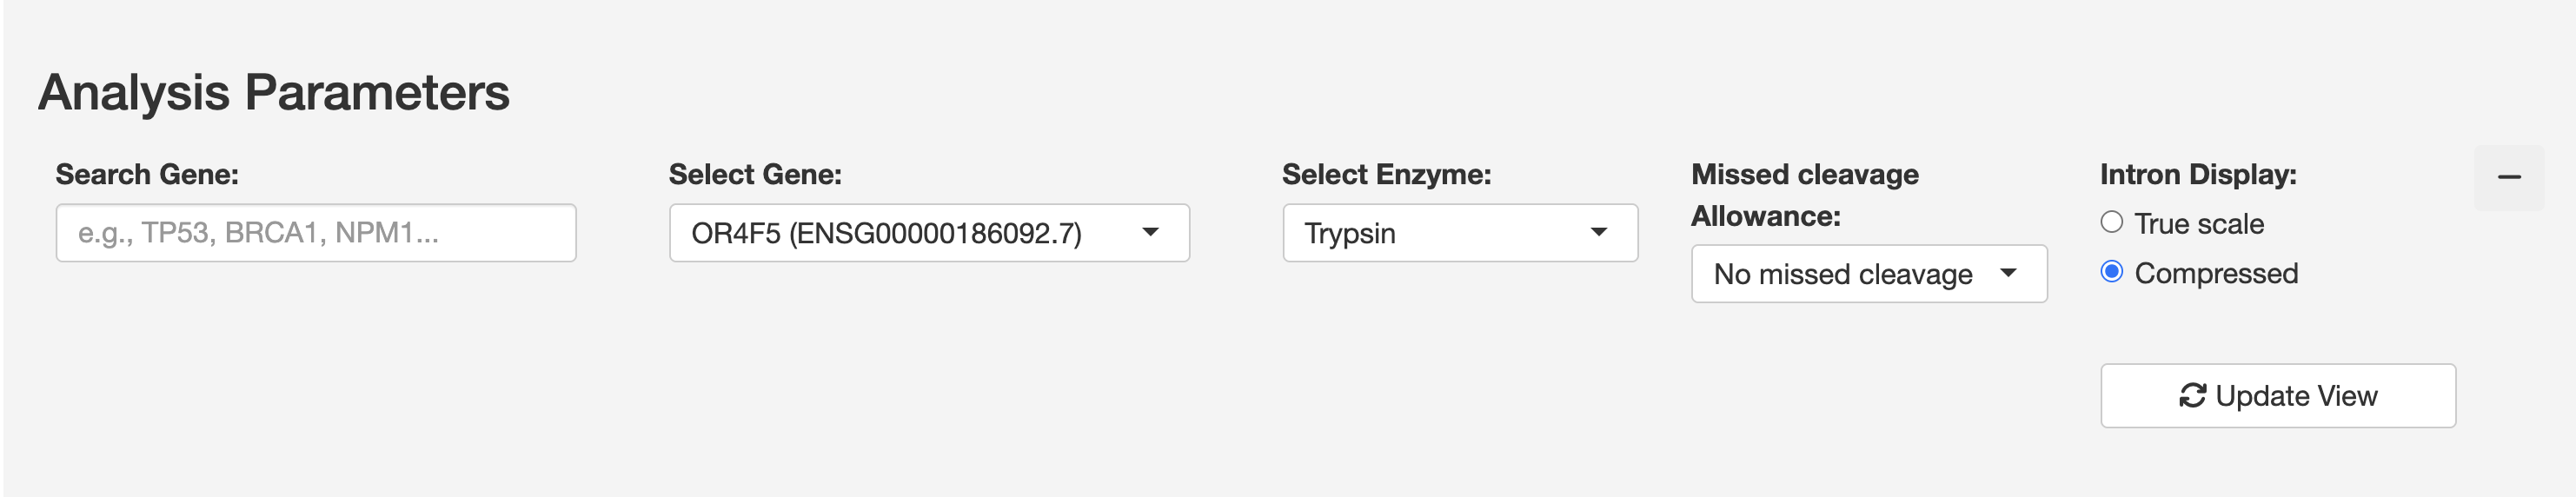
Analysis Parameters – select a gene, enzyme, missed-cleavage allowance, and intron display mode before updating the view.
The Canonical module provides comprehensive analysis of known peptides across different protein isoforms. It is divided into three complementary analysis approaches, accessible via the tabs at the top of the page.
1. Overview Analysis
Gene selection and basic visualization interface.
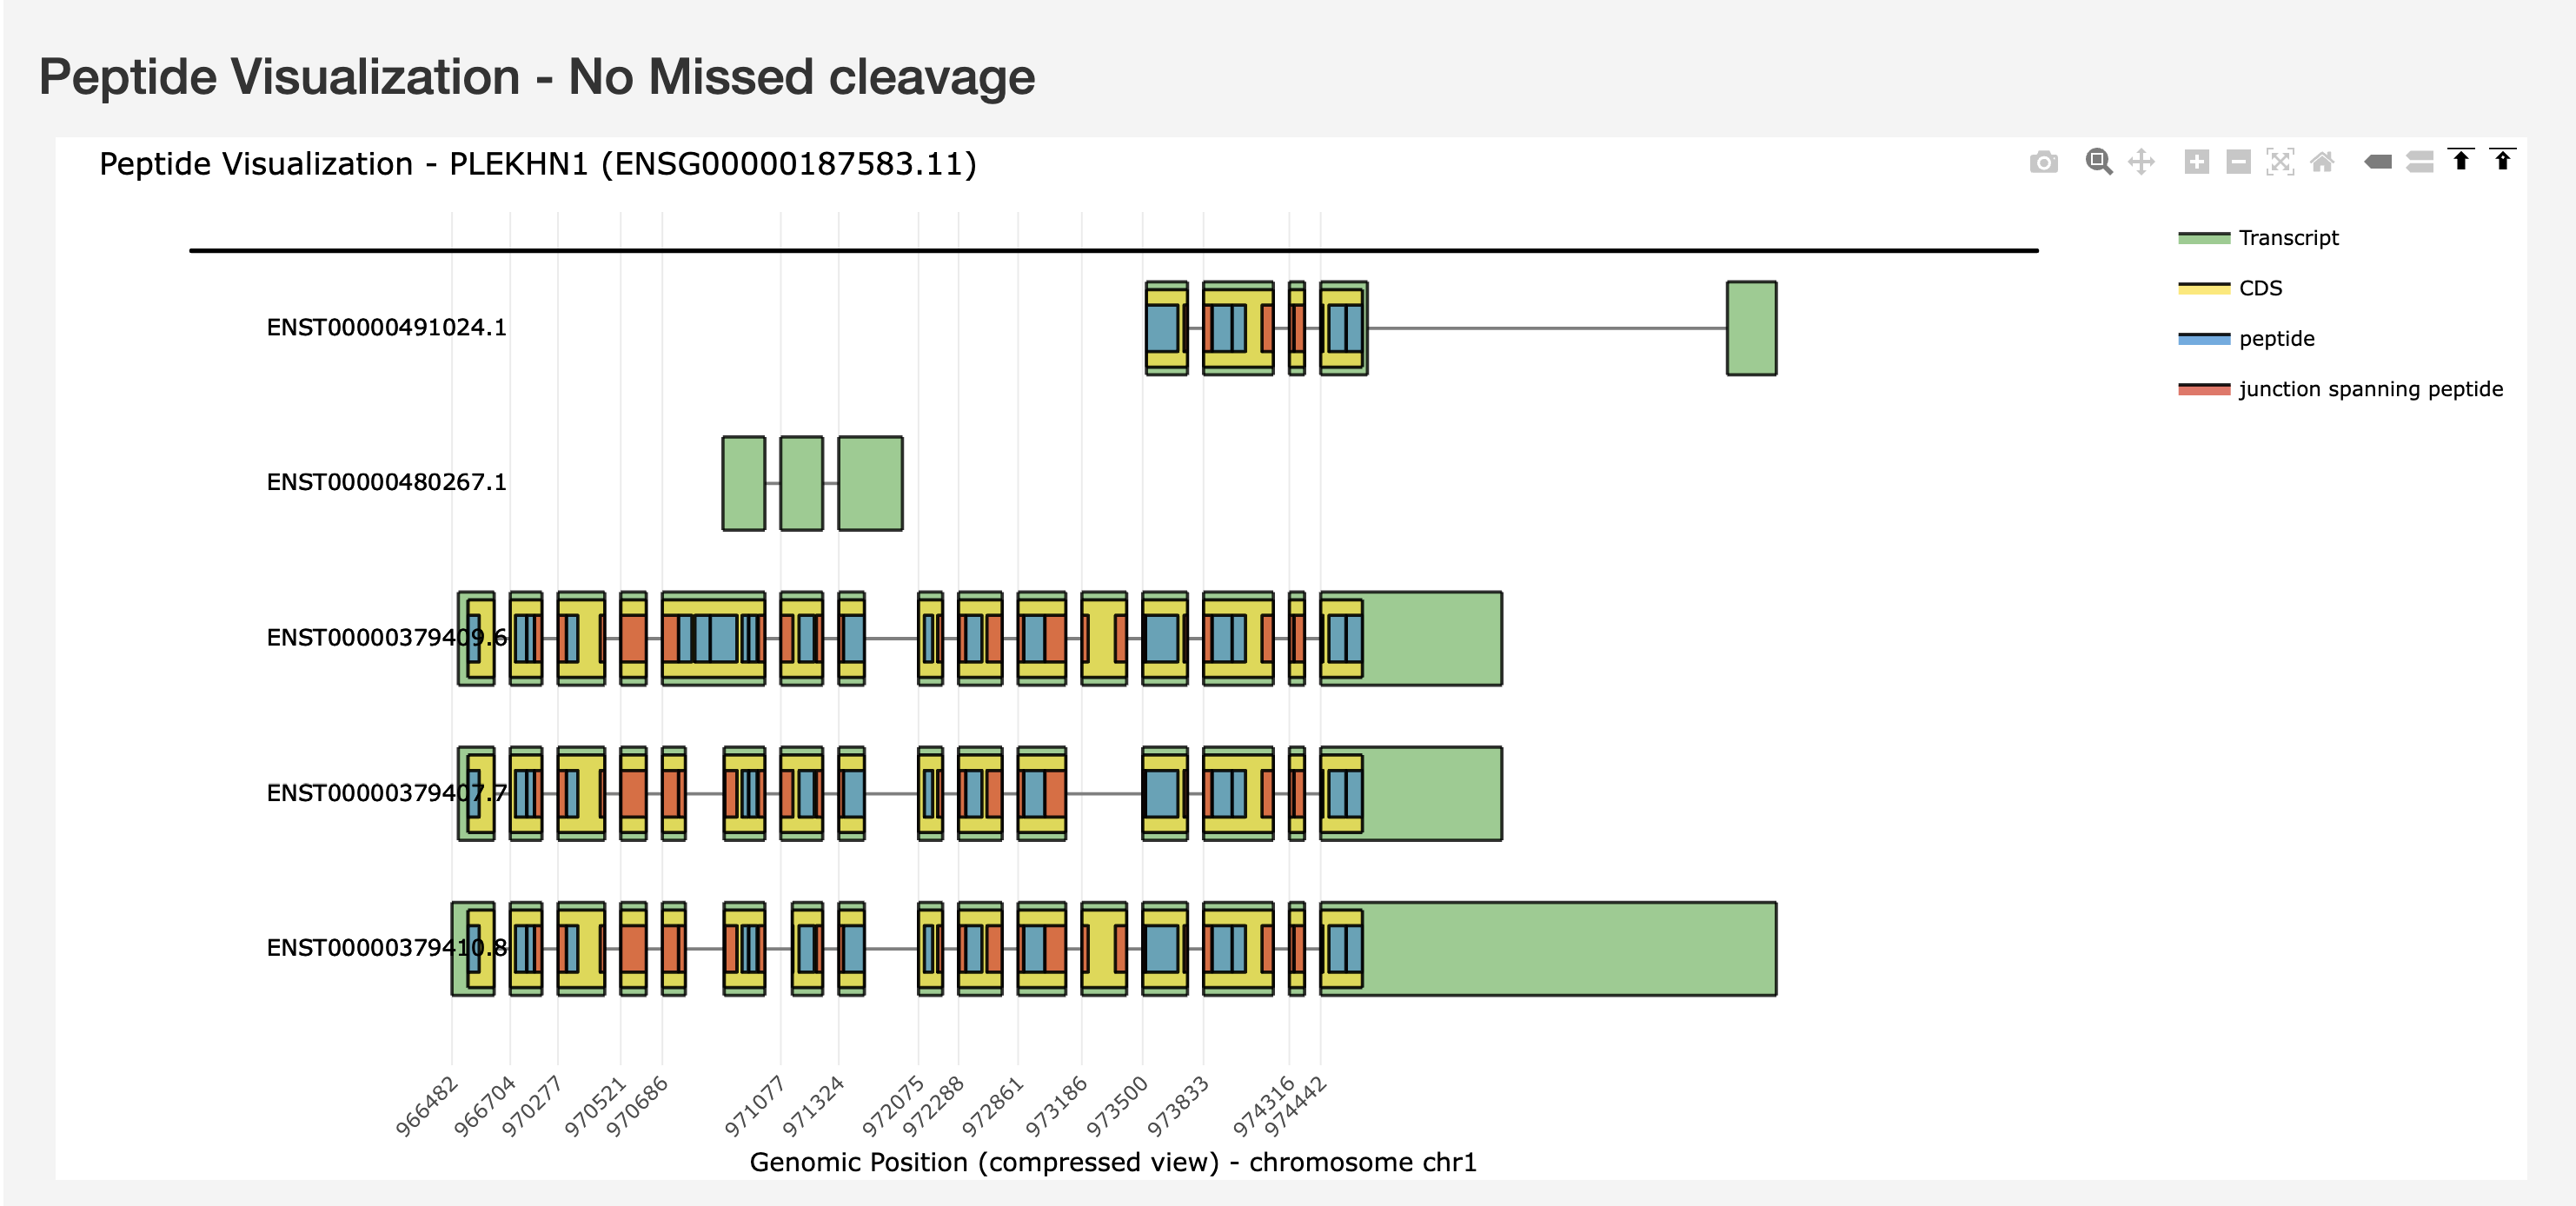
The Overview tab shows the full gene structure with all protein isoforms and their peptide maps at a glance.
2. Events-Centric Analysis
Focus your analysis on specific splicing events and their peptide consequences.
Features:
Splicing event selection
Visualization of event impacts on peptides
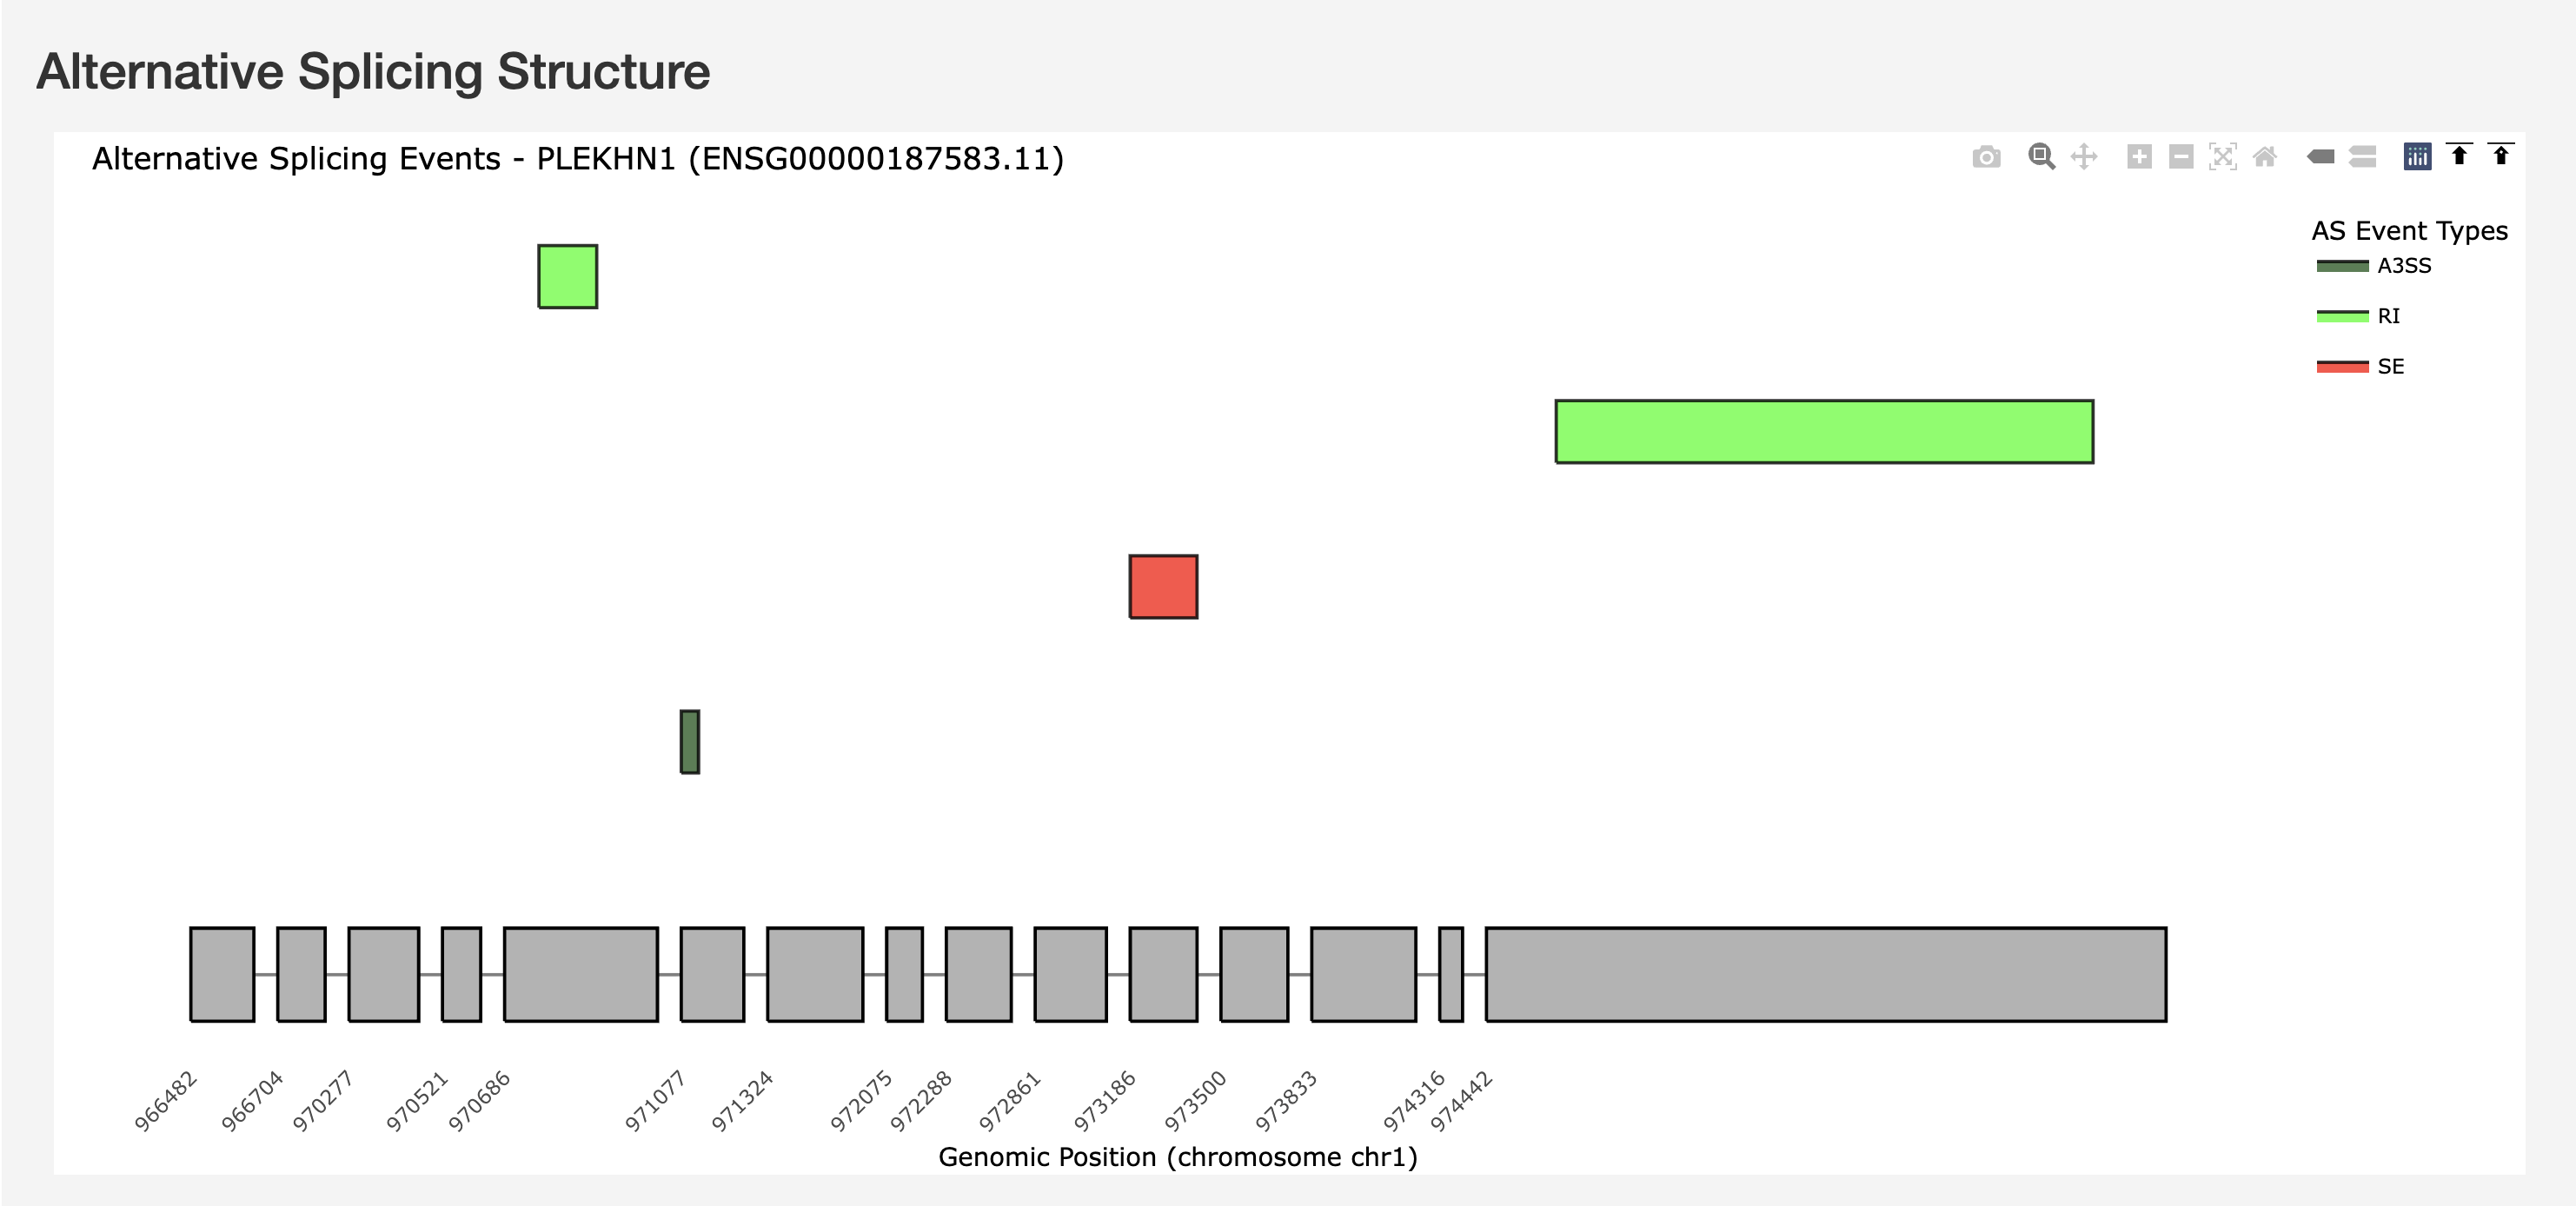
Alternative Splicing Structure showing AS event types (A3SS, RI, SE) mapped on the gene structure with genomic coordinates.
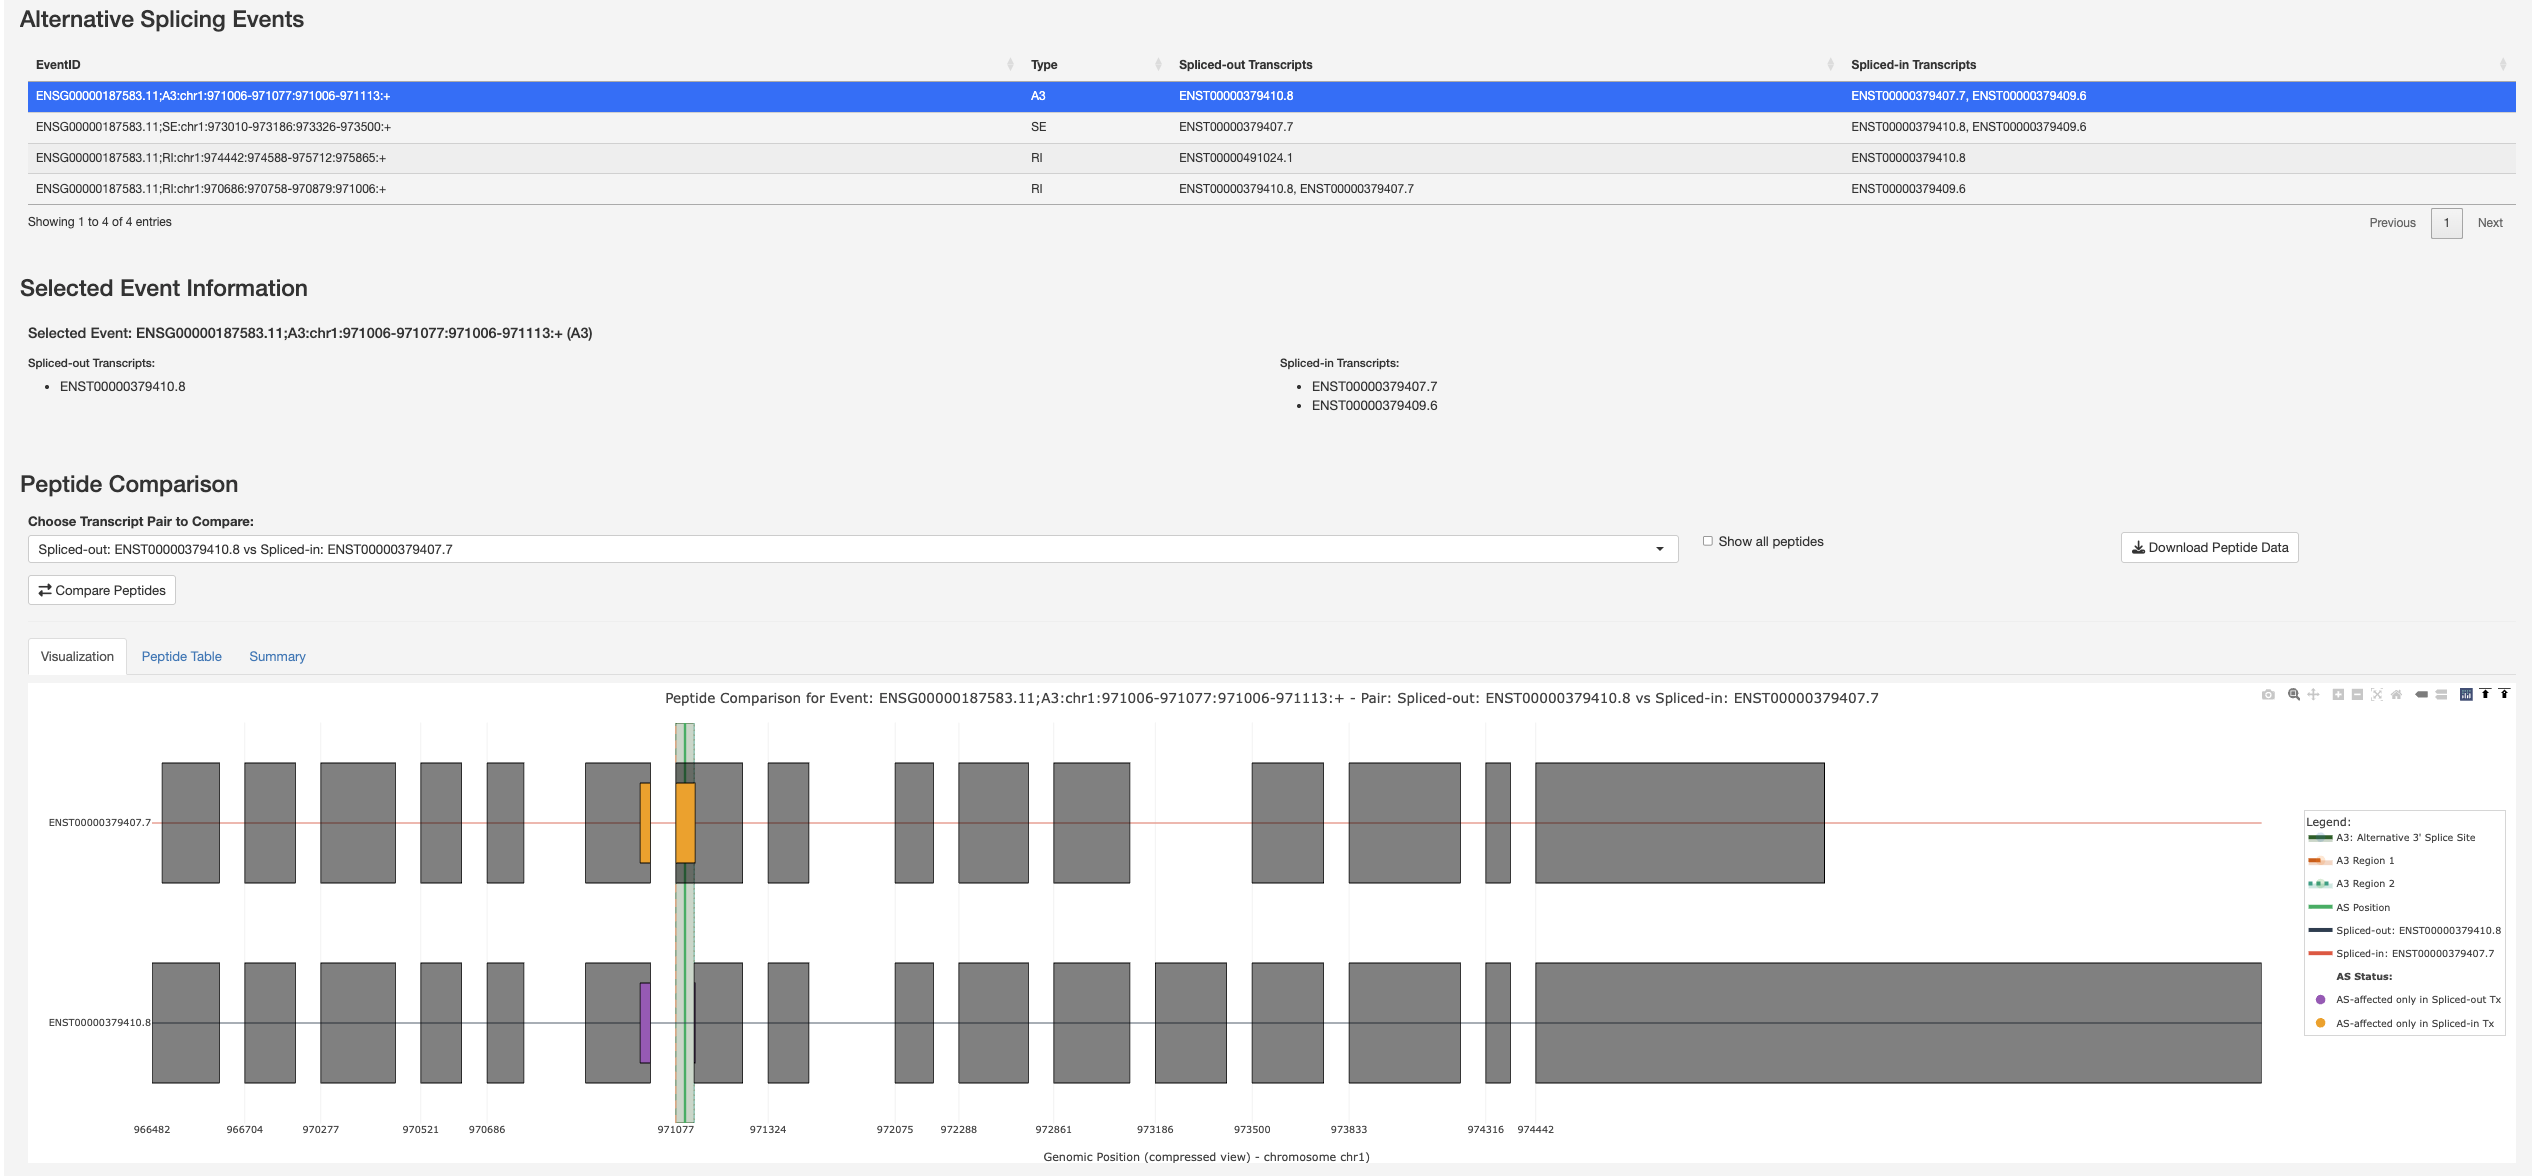
Alternative Splicing Events table with selected event information and Peptide Comparison visualization for a selected splicing event, highlighting the spliced region and affected peptides across transcript pairs.
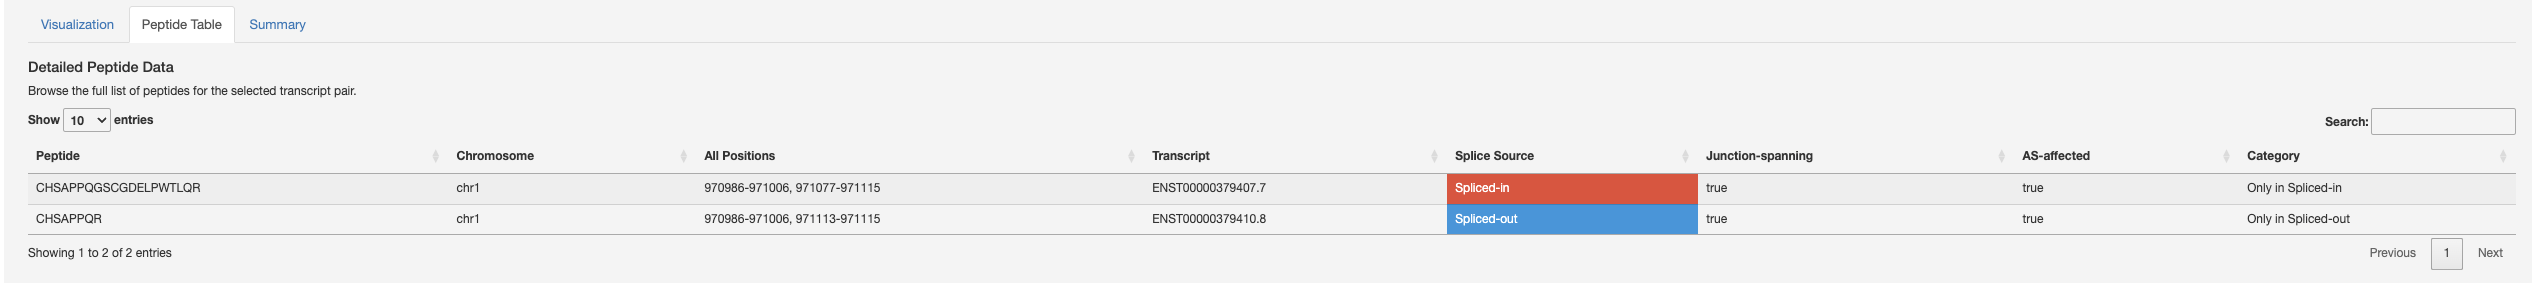
Detailed Peptide Data table listing each peptide with its genomic positions, splice source, junction-spanning status, and AS-affected category.
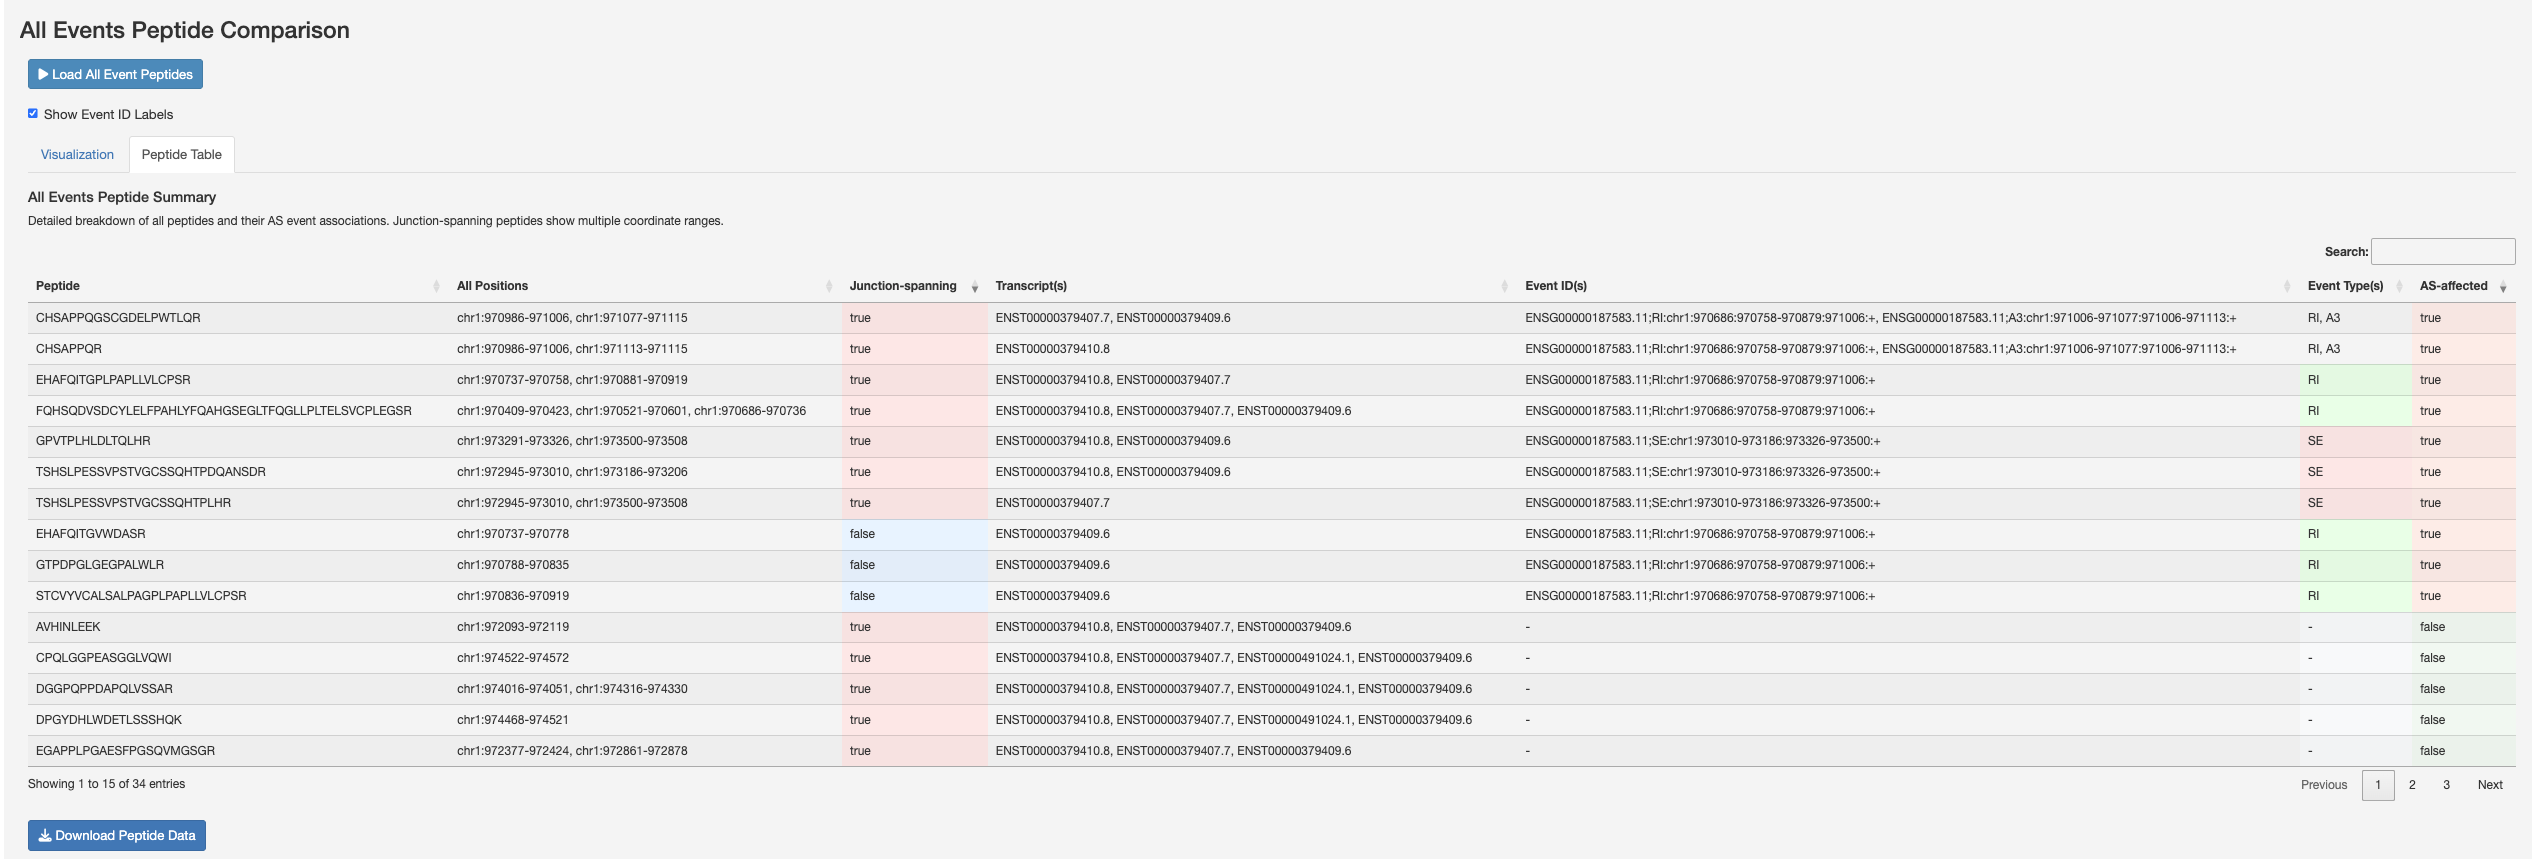
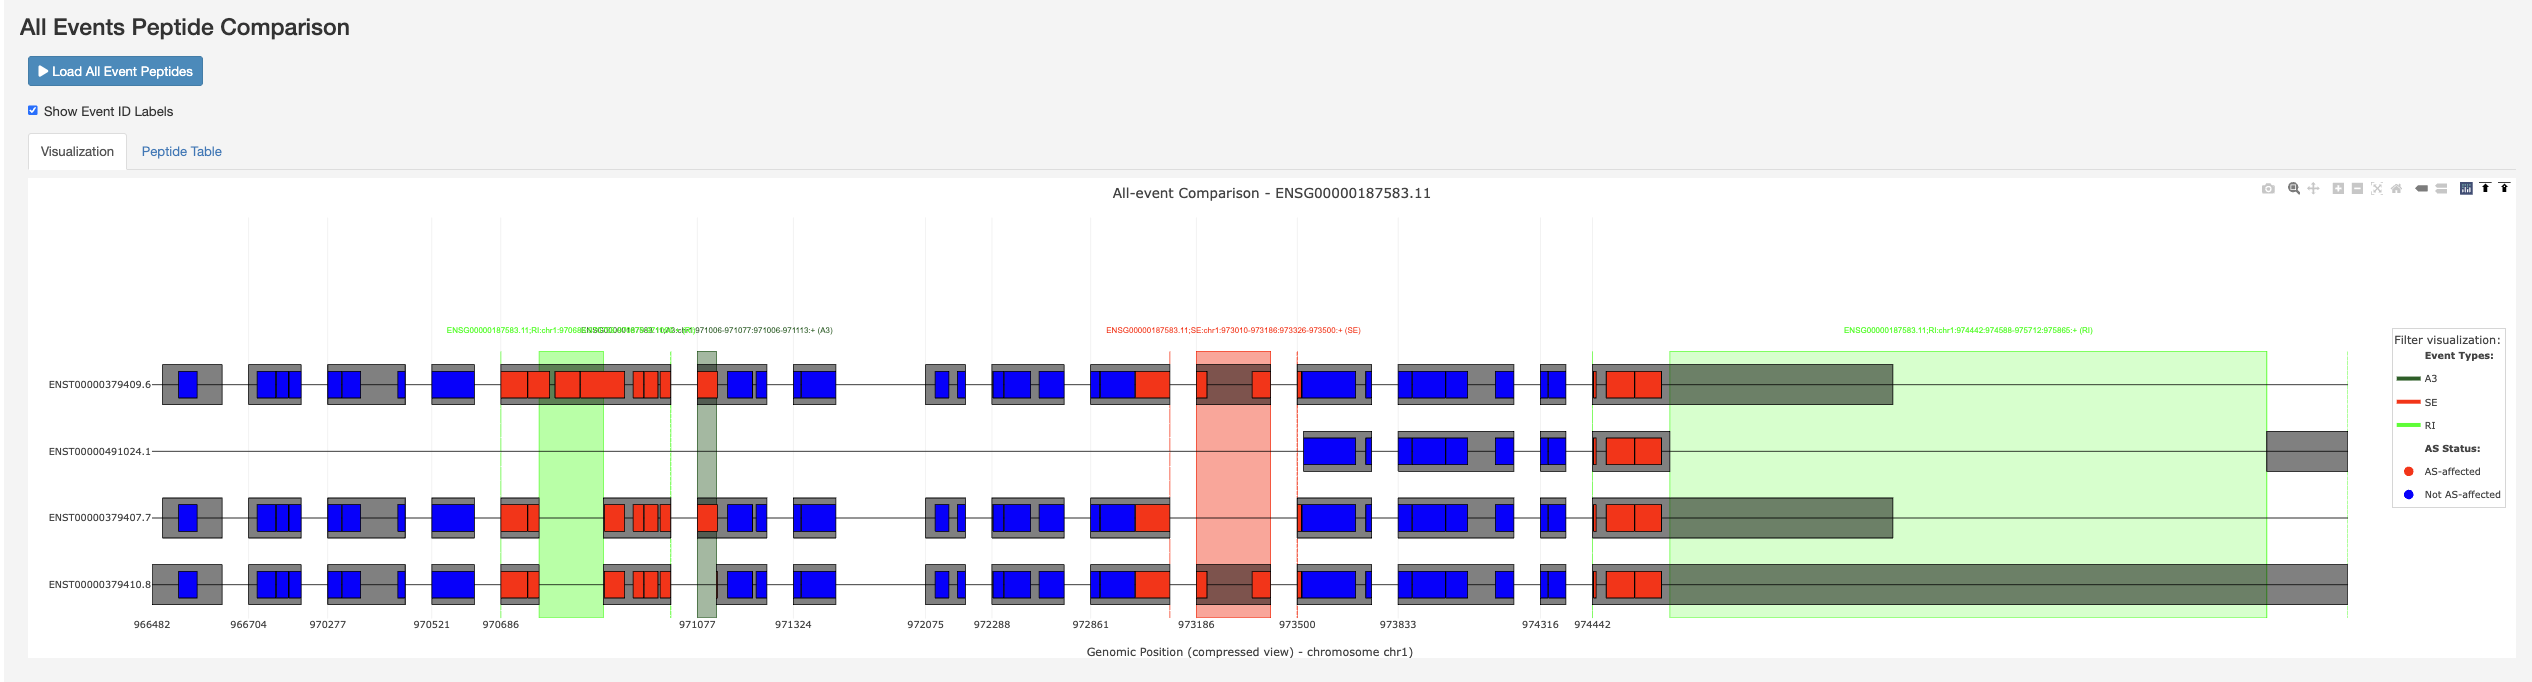
All Events Peptide Comparison – a gene-wide view of every splicing event (A3, SE, RI) overlaid on the transcript structures with AS-affected peptides coloured.
All Events Peptide Summary table with a breakdown of peptides, their event associations, junction-spanning status, and event-specific categories.
3. Isoform-Centric Analysis
Compare peptides across multiple protein isoforms with detailed protease analysis.
Features:
Multi-protein-isoform peptide comparison
Support for 6 proteases:
Trypsin
Chymotrypsin
AspN
LysC
LysN
GluC
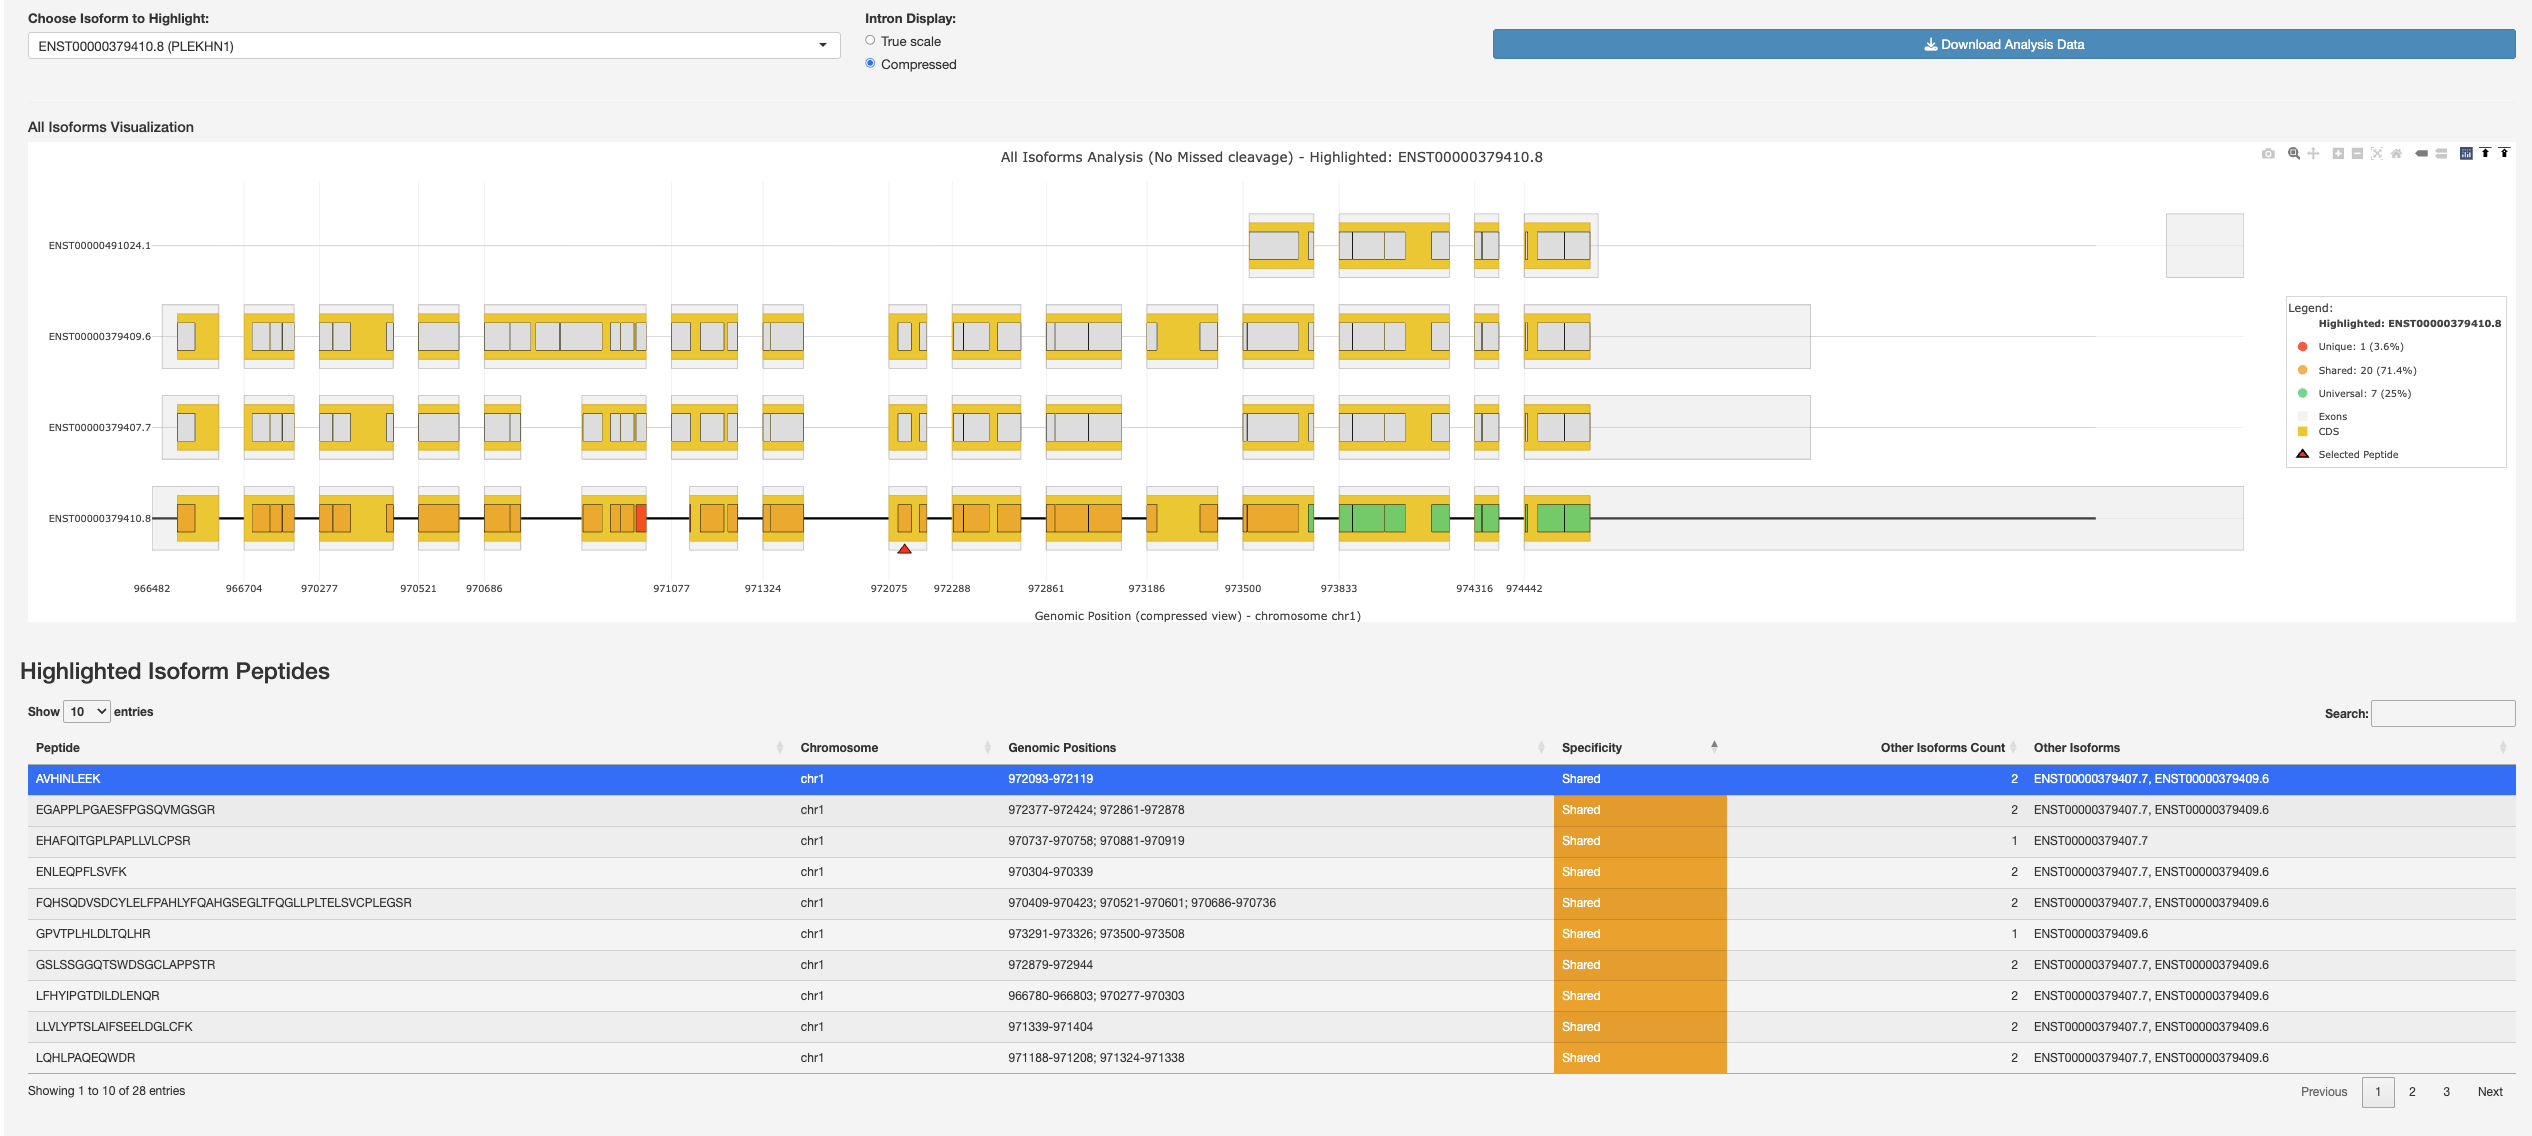
All Isoforms Visualization with a highlighted protein isoform and its peptide table showing peptide specificity (unique, shared, universal).
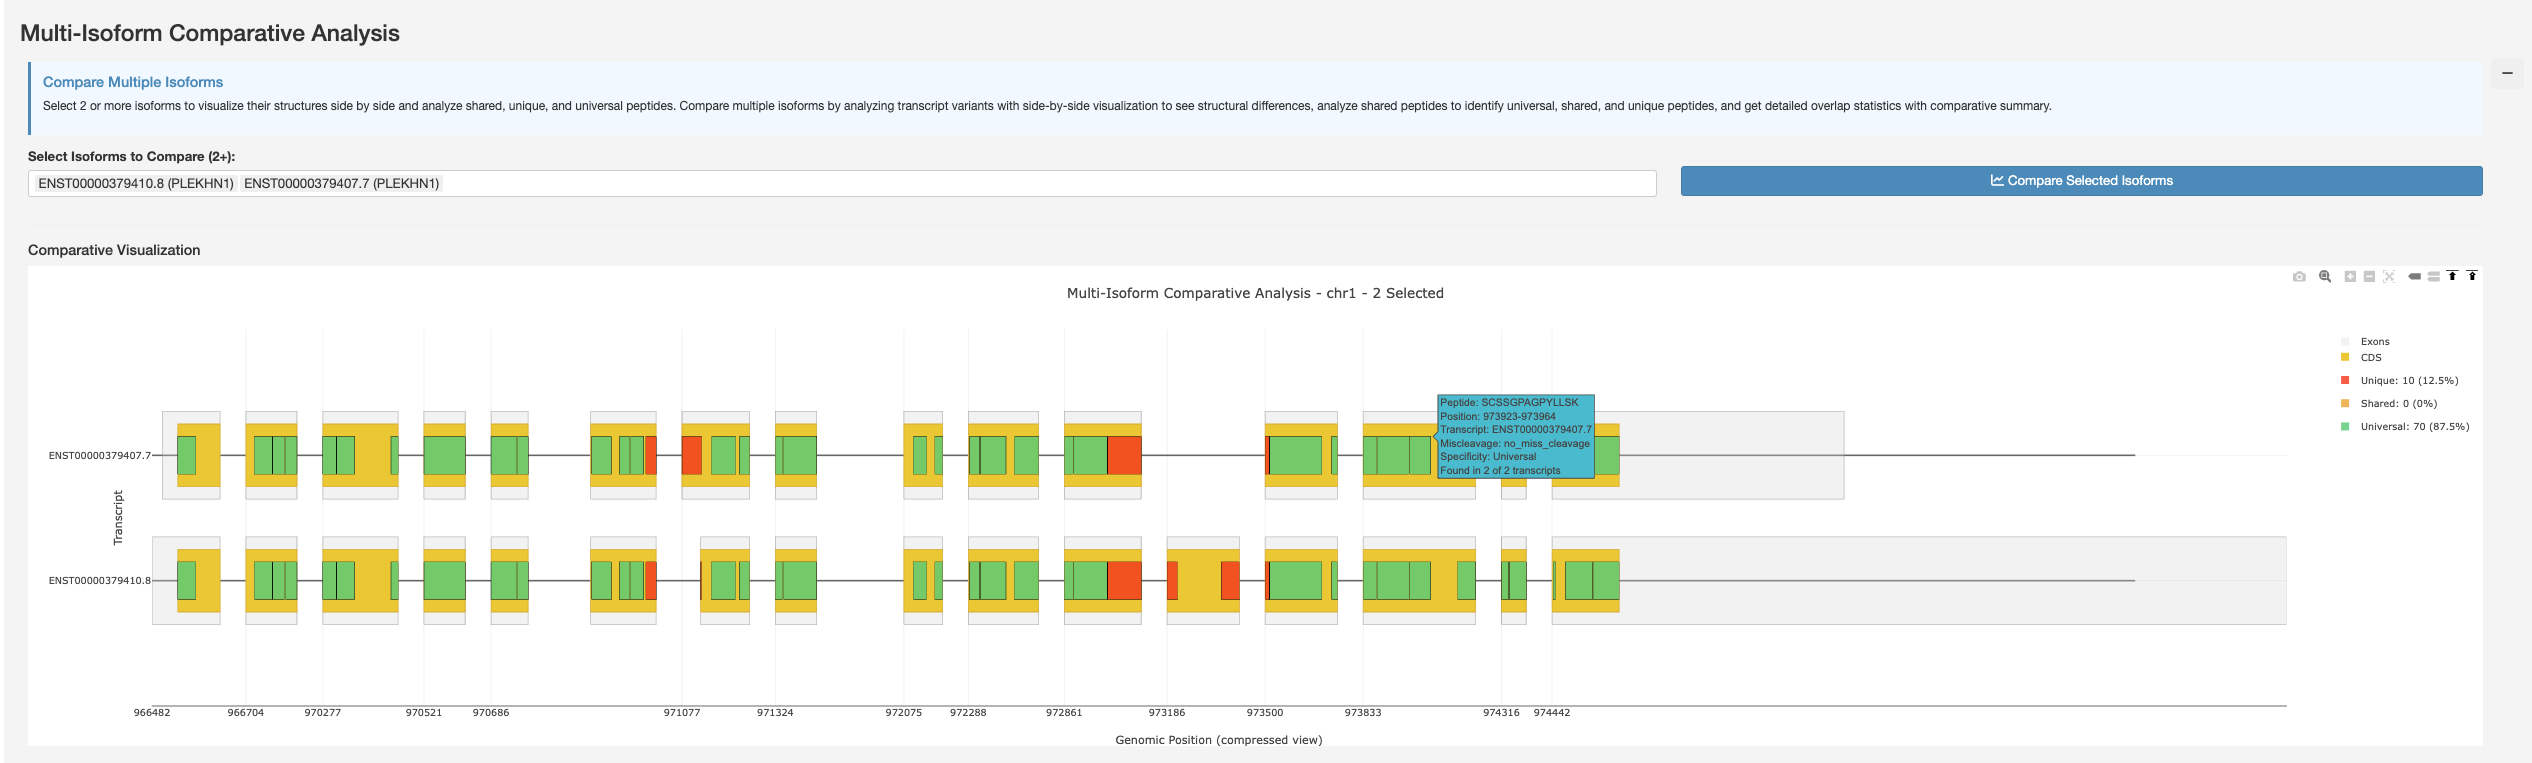
Multi-Isoform Comparative Analysis – select two or more protein isoforms to visualize their peptides and compare them.
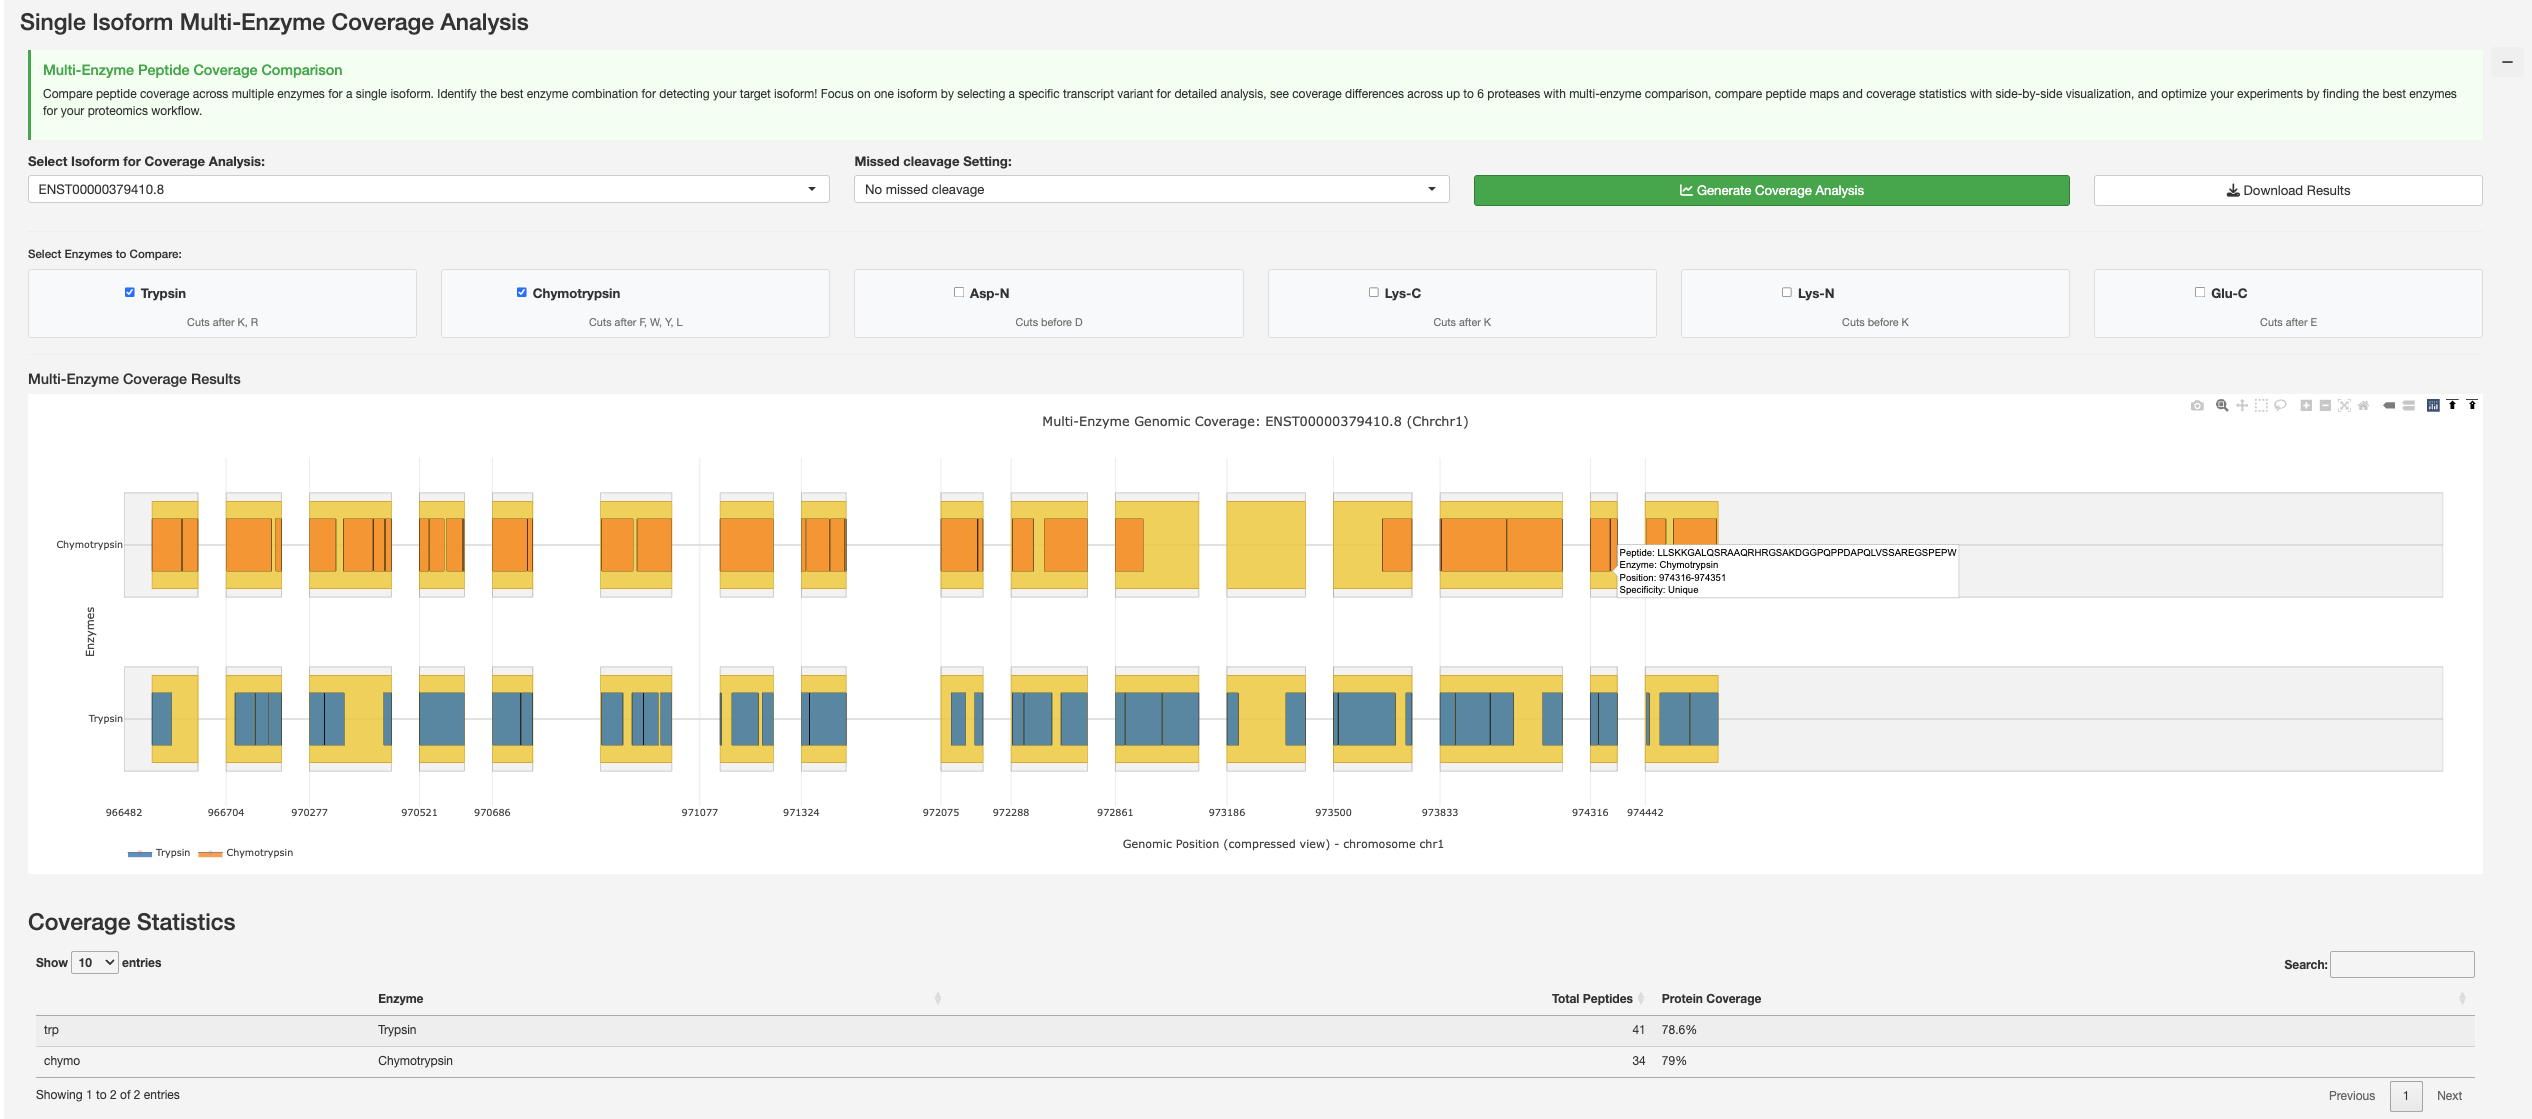
Single Isoform Multi-Enzyme Coverage Analysis comparing peptide coverage across multiple enzymes for a selected protein isoform with coverage statistics.
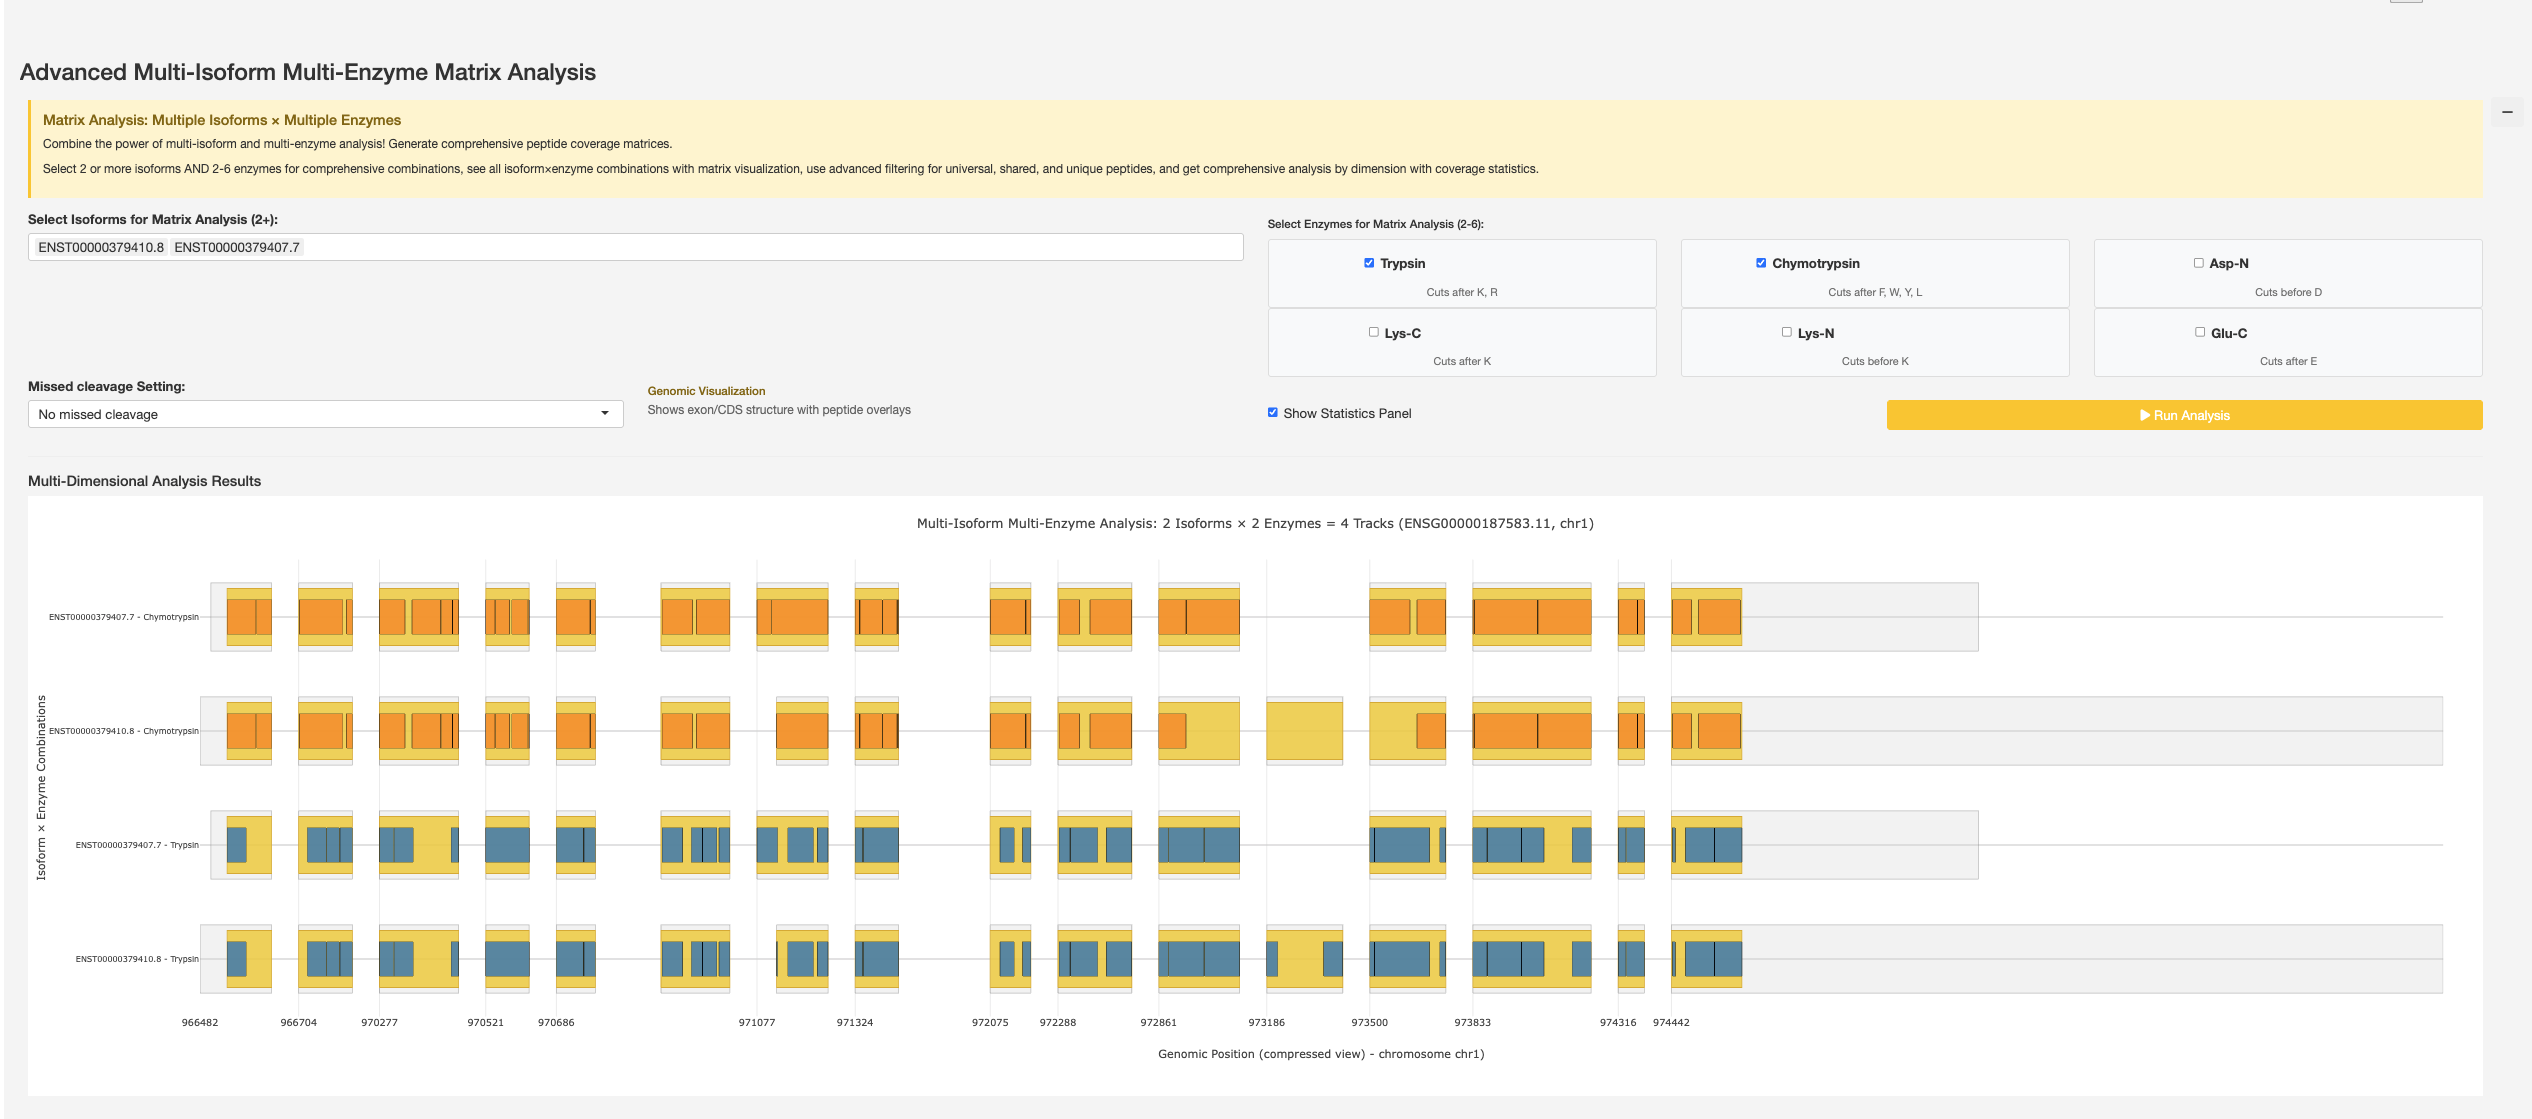
Advanced Multi-Isoform Multi-Enzyme Matrix Analysis combining multiple protein isoforms and enzymes for comprehensive multi-dimensional peptide coverage analysis.
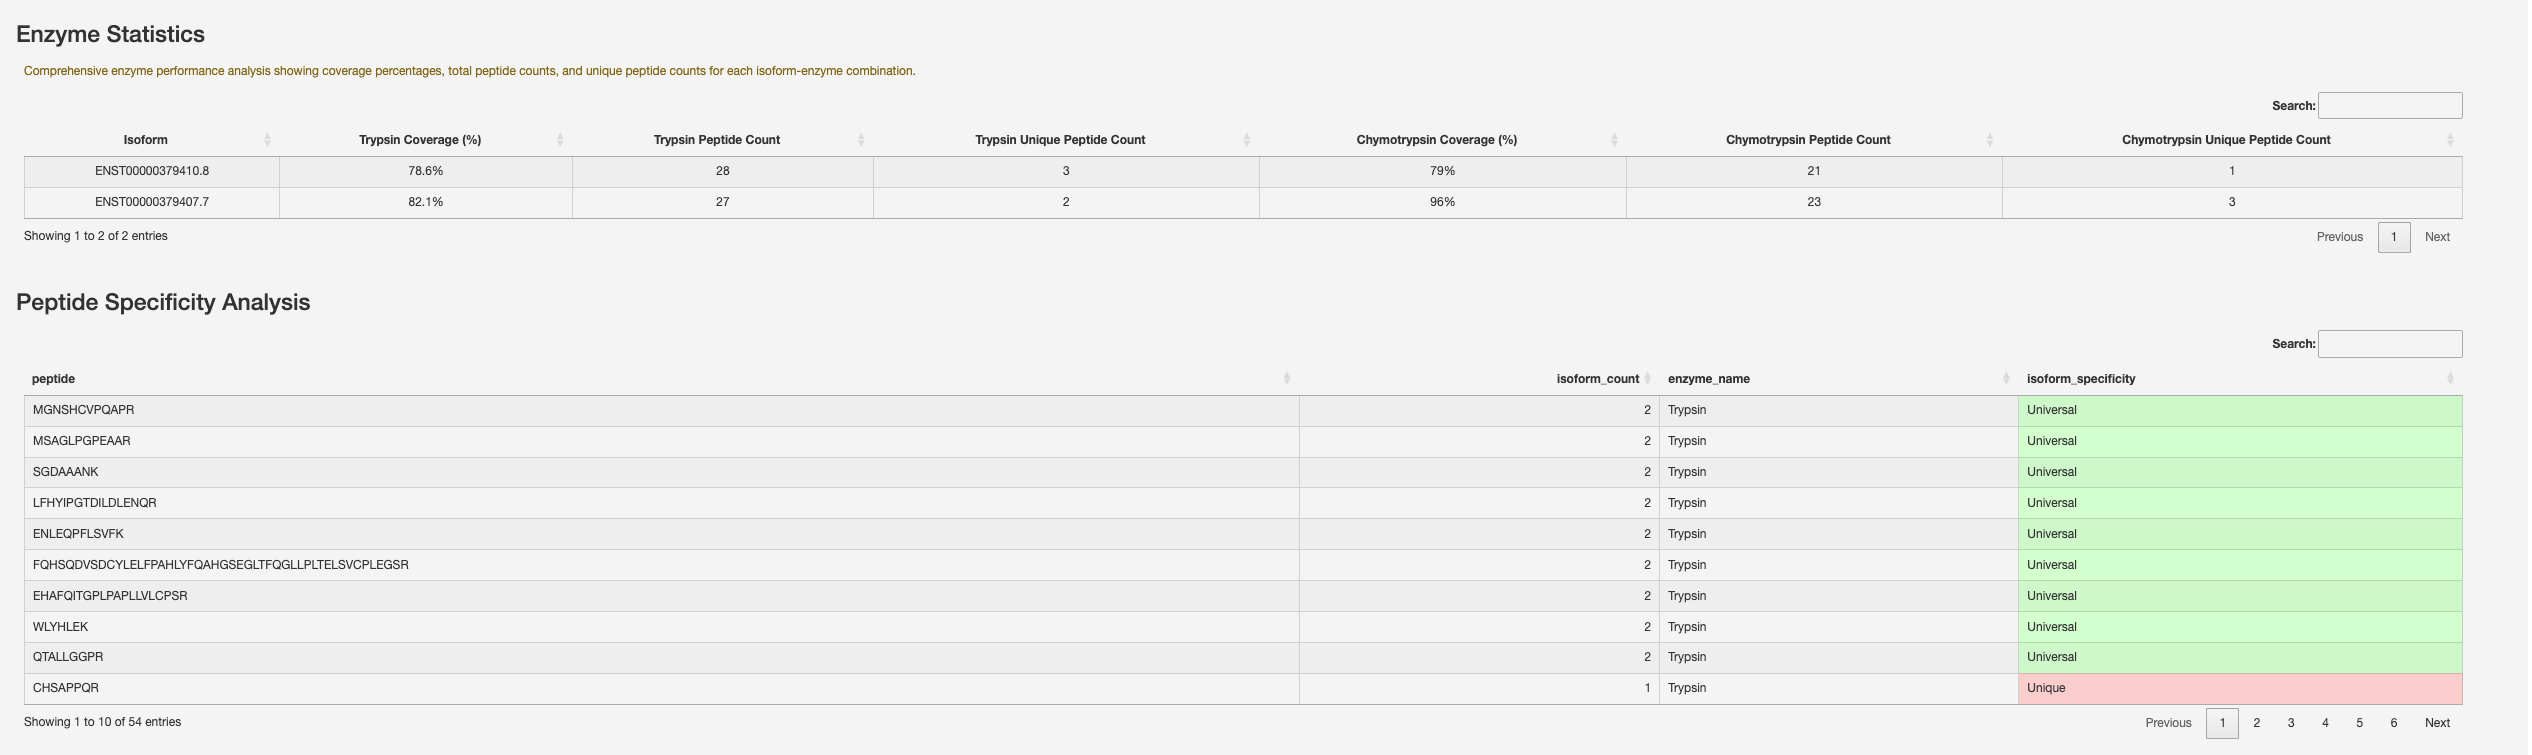
Enzyme Statistics showing coverage percentages, peptide counts, and unique peptide counts per protein isoform-enzyme combination, alongside Peptide Specificity Analysis.
Usage Workflow
Start with Analysis Parameters to select your gene of interest, configure the enzyme and missed-cleavage allowance, and click Update View. This loads the gene structure with all transcript protein isoforms and their peptide maps in the Overview tab.
Use the Events-Centric View tab to analyse specific splicing events:
Click on an event from the Alternative Splicing Events table to view the event structure and affected transcripts.
Select the pair of spliced-in and spliced-out transcripts for which you want to compare peptide sequences, then click Compare Peptides to see the peptide comparison due to the selected AS event.
Click Load All Event Peptides to view all events overlaid on the gene structure and their combined peptide summary.
Use the Isoform-Centric View tab to explore peptides at the protein isoform level. Click Load Isoforms to launch the analysis, then:
Pick a protein isoform from the Choose Isoform to Highlight dropdown to view its peptide map and specificity table.
Select two or more protein isoforms and click Compare Selected Isoforms to see which peptides are unique, shared, or universal.
Run Single Isoform Multi-Enzyme Coverage to compare how different enzymes cover a single protein isoform.
Run Advanced Multi-Isoform Multi-Enzyme Matrix to compare coverage across multiple protein isoforms and enzymes at once.